Your task is to estimate how far an object traveled during the time interval , but you only have the following data about the velocity of the object.
| time (sec) | 0 | 1 | 2 | 3 | 4 | 5 | 6 | 7 | 8 |
| velocity (feet/sec) | -4 | -2 | -3 | 1 | 2 | 3 | 2 | 3 | 4 |
To get an idea of what the velocity function might look like, you pick up a black pen, plot the data points, and connect them by curves.
Your sketch looks something like the black curve in the graph below.
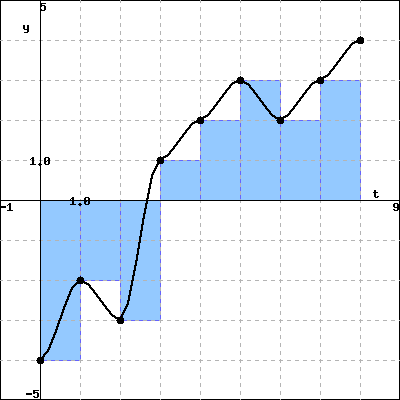 |
| Left endpoint approximation |
You decide to use a left endpoint Riemann sum to estimate the total displacement. So, you pick up a blue pen and draw rectangles whose height is determined by the velocity measurement at the left endpoint of each one-second interval. By using the left endpoint Riemann sum as an approximation, you are assuming that the actual velocity is approximately constant on each one-second interval (or, equivalently, that the actual acceleration is approximately zero on each one-second interval), and that the velocity and acceleration have discontinuous jumps every second. This assumption is probably incorrect because it is likely that the velocity and acceleration change continuously over time. However, you decide to use this approximation anyway since it seems like a reasonable approximation to the actual velocity given the limited amount of data.
(A) Using the left endpoint Riemann sum, find approximately how far the object traveled. Your answers must include the correct
units.
Total displacement =
Total distance traveled =
Using the same data, you also decide to estimate how far the object traveled using a right endpoint Riemann sum. So, you sketch the curve again with a black pen, and draw rectangles whose height is determined by the velocity measurement at the right endpoint of each one-second interval.
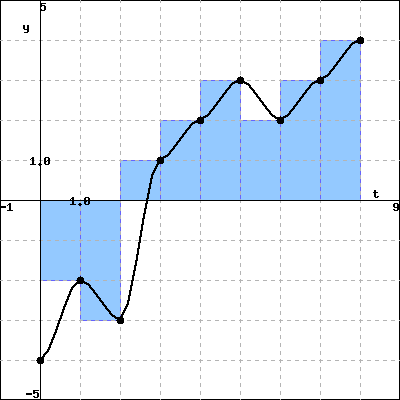 |
| Right endpoint approximation |
(B) Using the right endpoint Riemann sum, find approximately how far the object traveled. Your answers must include the correct
units.
Total displacement =
Total distance traveled =